What is Customer Effort Score (CES)?
Users want one thing: to complete their tasks without frustration. Whether they're buying a product, finding information, or getting support, low-effort experiences keep customers coming back. High-effort experiences send them to competitors.
Customer Effort Score (CES) measures exactly this. It reveals how much work users need to accomplish basic tasks on your site. Unlike CSAT or NPS surveys, CES pinpoints specific friction points that drive customers away.
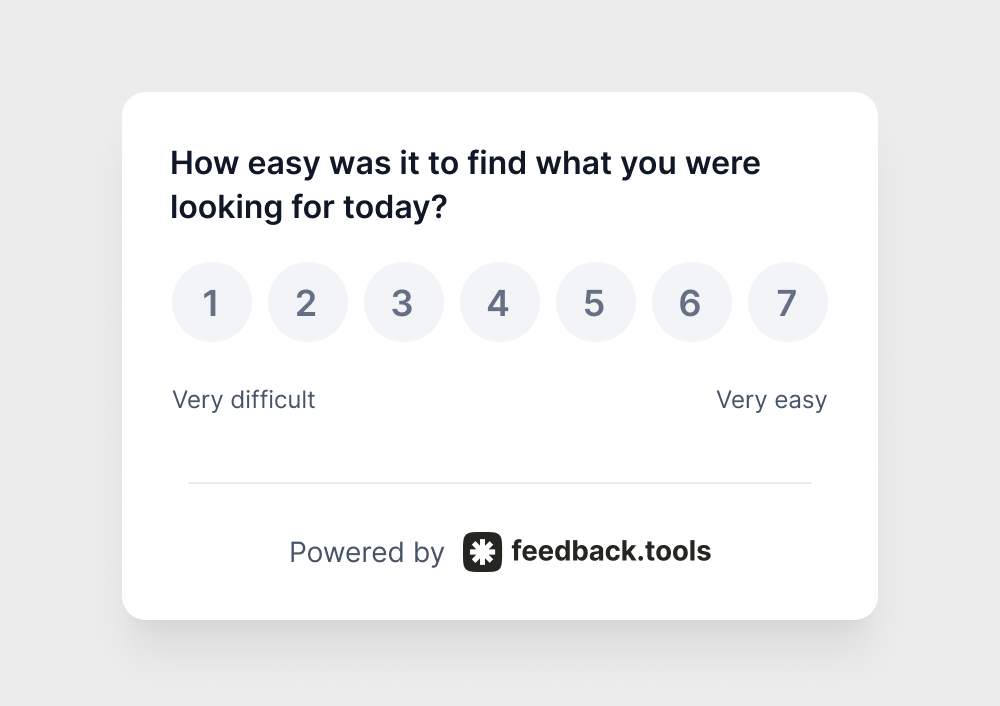
Customer Effort Score tracks the difficulty level of specific user interactions.
After someone completes a task, they answer one simple question:

Responses typically use a scale from 1 to 7, where 1 means "very difficult" and 7 means "very easy."
The beauty of CES lies in its timing and specificity. You're not asking about overall satisfaction weeks later. You're capturing immediate reactions to precise moments like checkout, account creation, or support interactions.
CES questions that work
Product owners get the best results when they ask targeted questions:
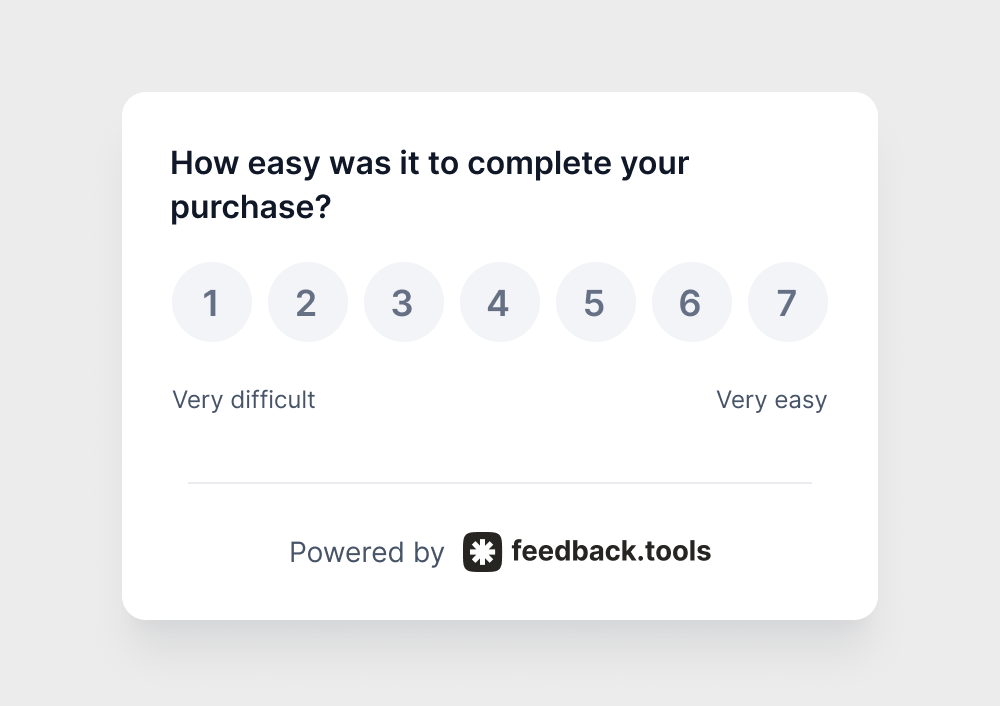
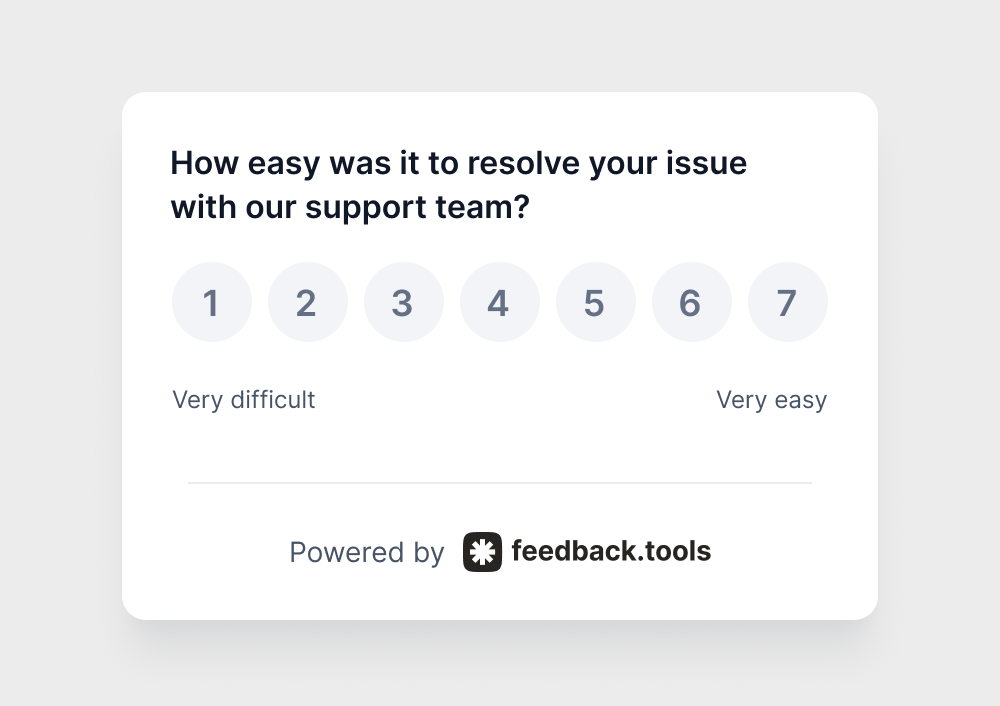
Each question connects directly to a specific user journey step, making the feedback actionable.
Why CES beats satisfaction scores
Low-effort experiences create loyal customers. Research consistently shows that customers who experience minimal friction are more likely to make repeat purchases and recommend businesses to others.
Here's what makes CES particularly valuable: customers can feel satisfied with your product but still struggle with your processes. They might love your software features but find the signup process confusing. They could appreciate your customer service team's helpfulness but get frustrated navigating your support system.
CES captures these process problems that satisfaction surveys miss. A customer might rate their overall experience as "good" while still rating specific tasks as "high effort." Those high-effort moments are exactly what drive customers to competitors.
The cost of friction
When users encounter friction, they make quick decisions:
- Customers who experience high-effort interactions become disloyal
- Customers who have low-effort experiences are likely to recommend your business
- Most customers will switch to competitors after just one difficult experience
These patterns highlight why measuring and reducing customer effort should be a priority for any business with an online presence.
How to calculate CES
Most businesses calculate CES using the percentage method. Here's how it works:
- Collect responses on a 1-7 scale (1 = very difficult, 7 = very easy)
- Count responses of 5-7 as "low effort"
- Divide low-effort responses by total responses
- Multiply by 100 for your percentage
Example: 100 customers respond to your CES survey. 70 customers rate their experience as low effort (scores of 5-7). Your CES is 70%.
Some companies prefer averaging all scores instead. Both approaches work, but the percentage method makes it easier to set improvement targets and track progress over time.
Success stories
Checkout success story
An online electronics store noticed their CES dropping during checkout. Customer feedback revealed that the shipping calculator was confusing and slow. Users couldn't easily see delivery options or costs.
The team simplified the shipping process by:
- Showing all delivery options upfront
- Calculating costs automatically based on zip code
- Adding clear delivery date estimates
Result: CES improved from 60% to 78% within two months. More importantly, cart abandonment rates dropped by 15%.
Onboarding success story
A project management software company tracked CES for their new user onboarding process. Despite having helpful features, users consistently reported high effort when setting up integrations with other tools.
The product team discovered that users were getting lost in technical documentation. They created:
- Step-by-step visual guides for popular integrations
- Interactive tutorials within the app
- Quick-start templates for common use cases
Result: New user CES scores improved from 45% to 82%. User activation rates increased by 23% as more people successfully completed onboarding.
Best practices
Time it right
Timing is everything with CES surveys. Send them immediately after the specific interaction you want to measure. Waiting too long means customers forget details about their experience, and you lose the emotional context that makes feedback valuable.
Set up automated triggers for key moments:
- Right after checkout completion
- Immediately following support ticket resolution
- After account creation or profile setup
- Following feature adoption or tutorial completion
Target specific moments
Instead of asking about overall effort, pinpoint exact moments in the user journey. This gives teams clear areas to improve rather than vague feedback about general satisfaction.
Break down your measurement strategy:
- Homepage navigation: How easy is it to find product information?
- Search functionality: How easy is it to locate specific items?
- Account management: How easy is it to update profile settings?
- Support access: How easy is it to get help when needed?
Watch the trends
Individual CES scores matter less than patterns. Monitor how effort levels change as you make improvements or launch new features. Look for:
- Seasonal patterns that might affect user behavior
- Correlations between effort scores and conversion rates
- Impact of design changes on specific user segments
- Differences in effort scores across device types or browsers
Combine with other metrics
Customer Effort Score works best alongside other feedback collection methods. This combination reveals both what's difficult and why customers feel that way.
Use CES with:
- Open-ended feedback to understand the reasons behind high-effort scores
- User behavior analytics to see where people struggle before they report it
- A/B testing results to validate whether changes actually reduce effort
- Net Promoter Score to understand the relationship between effort and loyalty
Mistakes to avoid
Too many questions
Keep CES surveys short and focused. One primary effort question with an optional follow-up for context works better than long questionnaires that create survey fatigue.
Poor timing
Don't send CES surveys on a schedule disconnected from user actions. "How was your experience this month?" doesn't capture specific friction points like "How easy was it to reset your password?"
Ignoring neutral scores
Customers who rate experiences as "moderate effort" (scores of 4-5) represent opportunity. They're not frustrated enough to leave, but they're not having the smooth experience that builds loyalty either.
Measuring without action
Collecting CES data means nothing without follow-up improvements. Set clear processes for reviewing scores, identifying patterns, and implementing changes based on what you learn.
From clusters to action
Find quick wins
Look for high-impact, low-effort improvements first.
Common quick wins include:
- Simplifying form fields by removing unnecessary requirements
- Adding progress indicators to multi-step processes
- Improving error messages to be more helpful and specific
- Optimizing page load speeds for key conversion pages
Prioritize by impact
Not all high-effort touchpoints deserve equal attention.
Focus on areas where:
- High volumes of users encounter the friction point
- Business-critical actions like purchasing or signing up are affected
- Improvement opportunities align with existing development priorities
- Customer feedback consistently points to the same issues
Test systematically
A/B testing combined with CES measurement shows whether your improvements actually reduce customer effort.
Run tests that compare:
- Old vs. new process flows
- Different interface designs for the same task
- Various messaging approaches for error states
- Alternative layouts for complex forms
Business impact
Companies that successfully reduce customer effort see measurable business results:
Increased Revenue: Customers who experience low-effort interactions spend 88% more than those who encounter high-effort experiences.
Higher Retention: Businesses with strong CES scores have customer retention rates 5-10% higher than competitors.
Reduced Support Costs: When basic tasks become easier, support ticket volume drops significantly. Some companies see 20-30% reductions in common issue tickets.
Improved Word-of-Mouth: Customers who have effortless experiences are 94% more likely to recommend your business and 88% more likely to make repeat purchases.
Getting started
Customer Effort Score transforms abstract concepts like "user experience" into concrete, measurable metrics. Product owners who track CES consistently can identify friction points before they become major problems, leading to smoother user experiences and stronger customer relationships.
The question isn't whether you should measure customer effort. It's whether you can afford not to know how much work your customers are doing just to buy from you.
Turn effort clusters into action
Stop guessing where users struggle. feedback.tools automatically captures and organizes customer effort feedback, revealing exactly where friction hurts your business. Get started reducing customer effort today.