What is Net Promoter Score (NPS)?
High revenue doesn't always mean happy customers. Users might stick around due to switching costs, contracts, or lack of alternatives.
That's where Net Promoter Score (NPS) comes in. It reveals genuine customer loyalty through one powerful question: would your customers recommend you to others?
Why NPS works
Product teams use NPS to:
- Identify users at risk of churning before they leave
- Discover opportunities to turn satisfied users into advocates
- Measure the impact of product improvements over time
- Prioritize features that drive genuine customer satisfaction
The beauty of NPS lies in its simplicity. One question reveals whether users genuinely love your product enough to recommend it to others.
NPS scoring
NPS asks one simple question:
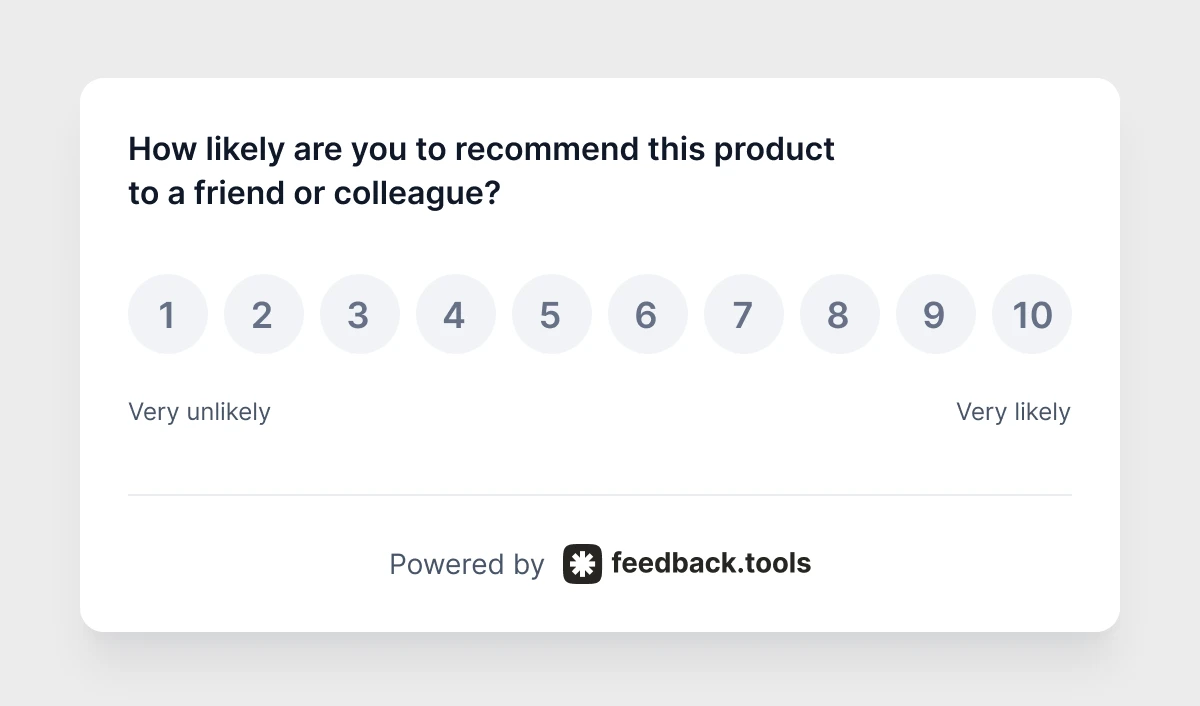
Users respond on a scale from 0 to 10.
NPS groups users into three categories based on their responses:
Promoters (9-10): These users love your product and actively recommend it to others. They're your biggest advocates and most valuable customers.
Passives (7-8): These users are satisfied but not enthusiastic. They won't actively promote your product, but they probably won't criticize it either.
Detractors (0-6): These users are unhappy and might actively discourage others from using your product. They represent your biggest opportunity for improvement.
Your NPS score is calculated by subtracting the percentage of detractors from the percentage of promoters. Scores range from -100 to +100, with anything above 0 considered positive.
Calculate NPS
Calculating NPS is straightforward once you understand the basic formula. Here's how to turn your survey responses into an actionable score.
The NPS formula: NPS = % Promoters - % Detractors
Step-by-step calculation:
-
Count your responses by category
- Count how many users gave scores 9-10 (Promoters)
- Count how many users gave scores 7-8 (Passives)
- Count how many users gave scores 0-6 (Detractors)
-
Calculate percentages
- Promoters % = (Number of Promoters ÷ Total Responses) × 100
- Detractors % = (Number of Detractors ÷ Total Responses) × 100
-
Apply the formula
- NPS = Promoters % - Detractors %
Real example with numbers:
Let's say you collected 200 NPS responses:
- 80 users gave scores 9-10 (Promoters)
- 60 users gave scores 7-8 (Passives)
- 60 users gave scores 0-6 (Detractors)
Here's the calculation:
- Promoters: 80 ÷ 200 = 40%
- Detractors: 60 ÷ 200 = 30%
- NPS = 40% - 30% = +10
Your NPS score would be +10, which means you have more promoters than detractors. Note that passives don't factor into the final calculation, but they represent opportunities for improvement.
What good NPS scores look like:
| Score Range | Rating | Description |
|---|---|---|
| Above 70 | Excellent | World-class companies |
| 50-70 | Great | Strong customer loyalty |
| 30-50 | Good | Room for improvement |
| 0-30 | Needs work | More detractors than promoters |
| Below 0 | Critical | Urgent attention required |
Check out our NPS calculator that provides a visual of the calculations.
From clusters to action
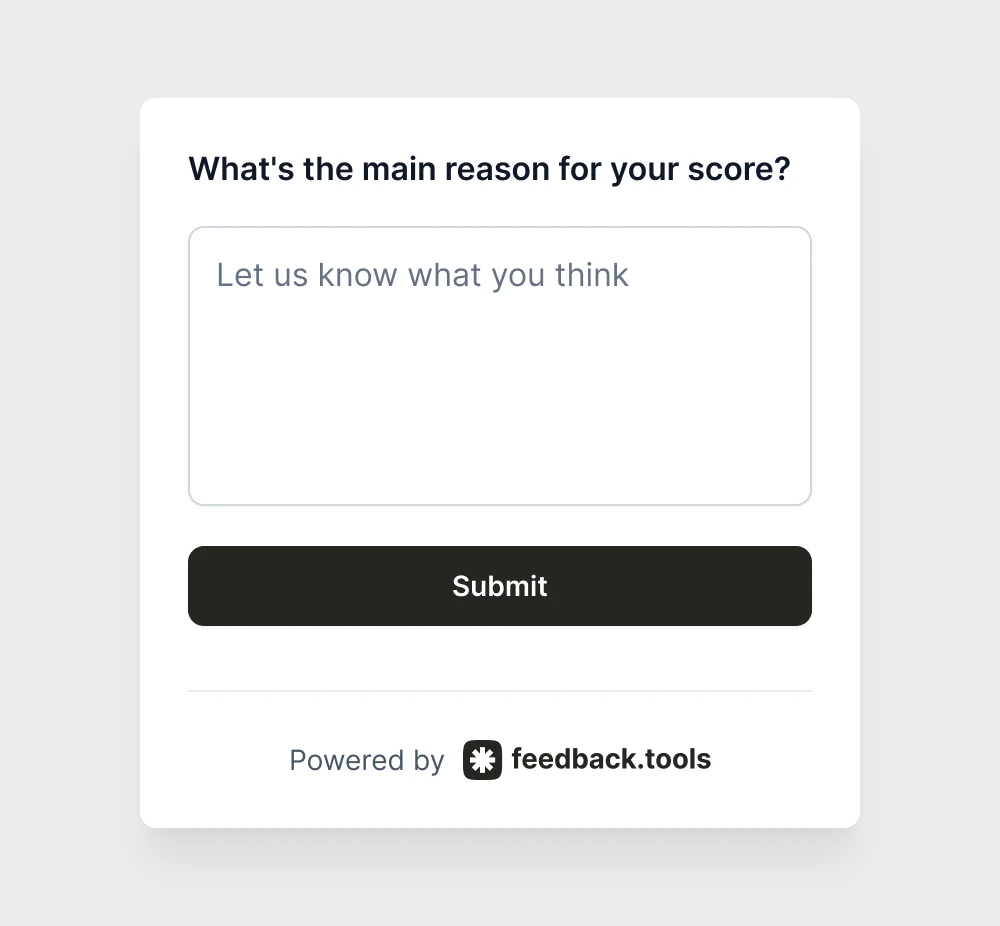
Numbers alone don't drive improvements. The real value comes from understanding why users gave their scores. Smart businesses follow up the rating question with:
For detractors: Focus on fixing pain points. If users consistently mention slow loading times or confusing navigation, these become immediate priorities.
For passives: Identify what would elevate their experience. Often, small improvements can move passives into the promoter category.
For promoters: Understand what they love most. These clusters help you double down on your strengths and communicate value to potential customers.
Real NPS wins
An online project management tool found 40% detractors, mostly citing "too complicated for small teams". This feedback led to a simplified onboarding flow and basic tier, improving NPS and significantly increasing conversions from small businesses.
A mobile app discovered promoters loved the offline functionality, while detractors struggled with syncing issues. The team prioritized sync improvements and highlighted offline features in marketing, turning detractors into passives and reducing monthly churn.
An e-commerce platform found that promoters praised their customer service, while detractors complained about shipping delays. They invested in faster shipping options and saw their NPS improve dramatically, leading to higher repeat purchase rates.
Better results
Time your surveys strategically: Send NPS surveys after users have experienced your product's core value. For SaaS products, this might be after completing their first project or reaching a usage milestone.
Keep surveys simple: Stick to the core NPS question plus one follow-up. Long surveys reduce response rates and dilute clusters.
Close the feedback loop: Always follow up with users who provide scores, especially detractors. This shows you value their input and often prevents churn.
Track trends over time: Single NPS scores provide snapshots. The real clusters come from watching how scores change as you implement improvements.
Beyond surveys
NPS works best as part of a comprehensive feedback approach. While NPS measures loyalty, other feedback methods reveal specific pain points and feature requests. Together, they provide a complete picture of user sentiment.
Product owners who combine NPS with ongoing feedback collection can spot trends early and respond quickly. This proactive approach turns potential detractors into satisfied users and transforms promoters into vocal advocates.
Modern feedback platforms can automatically analyze NPS responses alongside other user comments. AI-powered clusters help you discover patterns like:
- 60% of detractors mention the same checkout issue
- Promoters consistently praise your mobile experience
- Passives want better integration with existing tools
- Recent feature updates correlate with higher scores
Turn NPS clusters into action with AI
Stop manually analyzing survey responses. feedback.tools is the AI-powered-first platform that automatically analyzes all your user feedback, including NPS responses, to surface actionable clusters instantly. Get started with intelligent feedback analysis.
Get started
The key to successful NPS is consistency. Regular surveys help you measure progress and catch issues before they impact large numbers of users. When you know where you stand with customers, you can focus improvements where they matter most.
Start by establishing your baseline NPS score. Then implement improvements based on user feedback and measure the impact over time. This continuous cycle of feedback and improvement drives both customer satisfaction and business growth.